In late March 2020, we upgraded our production SQL Servers to SQL Server 2019 with CU3. After finishing the upgrade, we hit an issue with clustered columnstore that we hadn’t experienced in the previous version of SQL, SQL Server 2017. The issue also wasn’t something we encountered during our extensive testing on various servers in development, which dated back to September 2019. The problem has been mitigated, but I wanted to share our experience.
Background
We have one database in production, called PRIZM, which is made up exclusively of tables with clustered columnstore indexes. PRIZM is used for event tracking, and it backs our A/B testing, feature funnels, etc. in hopes of improving most of what we do. Because we use PRIZM everywhere, it’s one of our larger databases with lots of tables. At the time of the upgrade, the database was approximately 500GB with about 1000 tables.
There were various driving forces for it, but in early February we needed to purge data from PRIZM. Some of the reasons for doing so included:
- disk space being utilized
- general cleanup/removal of old events we no longer needed to maintain
- ease of GDPR compliance processing
We, or I should say Marc Gravell, deleted approximately 8 billion rows across 912 tables in the database. By doing this, we gained back drive space and removed data we no longer needed to keep.
After performing the deletions, we did some of the recommended maintenance on columnstore indexes. While many of the smaller tables were rebuilt, a handful of tables (11 total) weren’t rebuilt due to their size. Since we don’t have maintenance windows, it would be high-impact to attempt these rebuilds on a very active production environment.
The plan was to perform these table rebuilds after upgrading to 2019. SQL Server 2019 added the ability to rebuild clustered columnstore indexes online and that feature was one of the main reasons we wanted to upgrade.
Upgrade Day
I’m not going to cover our full upgrade to 2019 - that will hopefully be a later post. At this point, let’s just assume everything went as planned and this is picking up after the main failovers of the servers that run Stack Overflow and the rest of the public network.
After we finished the failovers for our public production servers, there was some behind the scenes work that needed to be done. This included patching and upgrading the former primary servers, and a failover of our reporting servers. The reporting cluster is a member of several distributed availability groups. When we’re doing upgrades, we move the primary server from New York (NY-RPTSQL01) to Colorado (CO-RPTSQL01). Once all the upstream SQL Servers are upgraded, there’s one last failover to get the primary back to NY-RPTSQL01. I’m specifically mentioning these servers because they receive data from PRIZM, so they are impacted by any activity in that database.
Transaction Logs Exponentially Growing
As I was upgrading the former primaries, I noticed the transaction log files for PRIZM were growing. Initially, I just assumed it was normal and I went about finishing my other tasks.
After about an hour, the log had grown again, and was growing rapidly. Like really rapidly, which was unusual. The logs were growing about 10GB every 5 minutes. We have lower traffic on the weekend so the amount of data being inserted into the database should not have been anywhere near this level.
Normally large transaction logs might raise my eyebrows, but I wouldn’t be super concerned. However, I needed to perform the failover of the reporting cluster, and with the logs increasing at the rate they were, it was going to make that more difficult, if not impossible.
If you’re not familiar with availability groups, the transaction logs from the primary server need to be written to the secondary servers. This same thing happens with distributed availability groups, but at a larger scale. In this case the transaction logs for the databases, including PRIZM which is on our primary server for Stack Overflow, needed to be flushed to the reporting cluster.
As the logs were increasing in PRIZM, they needed to be written to the reporting servers and CO-RPTSQL01 had a huge log send queue, and NY-RPTSQL01 had a huge recovery queue. Both of those are defined in the Microsoft docs, but I’ve included the definitions below:
- Log send queue - Amount of log records in the log files of the primary database, in kilobytes, that has not yet been sent to the secondary replica. This value is sent to the secondary replica from the primary replica. Queue size does not include FILESTREAM files that are sent to a secondary.
- Recovery queue - Amount of log records in the log files of the secondary replica that has not yet been redone.
The recovery queue needs to be at zero to failover - when it’s zero it means the server is caught up to the primary. Since there were transaction logs that needed to be written to the secondary in the reporting cluster, NY-RPTSQL01, I couldn’t failover.
What on Earth is Happening?
When I first noticed the log send queue size, it was about 90GB. Within just a few hours it was at 320GB, and growing.
We knew normal traffic wasn’t causing the increase. We also knew there wasn’t a delete job that would have triggered the massive growth of transaction logs, especially at the rate we were seeing. Now it was time to try and figure out what was causing the rapid growth.
I looked at our instance of OpServer to see if it reported any queries running against PRIZM. Nothing.
I executed sp_whoisactive. Nothing.
From what I was seeing it appeared “something” was crawling through our CCI tables and processing “something”. Like all the hand-wavy “something was doing something”? Yeah me too. We didn’t know what was happening and I was frantically trying to get it to stop.
I then executed sp_who2 and saw some PRIZM related things as background/system tasks, so I quickly wrote a script that would let me filter only for PRIZM:
|
|
The output of sp_who2 was repeatedly showing GHOST CLEANUP and CREATE INDEX. Over and over and over again. To be clear, I’m not a clustered columnstore expert, I know enough to be able to maintain them as needed. I went to Twitter and mentioned what I was seeing. I was advised by @sqL_handLe to try trace flag 661 which disables the ghost record removal process, and by Joe Obbish via Erik Darling to enable trace flag 634 to disable the tuple mover background task.
Initially, we enabled trace flag 634, but the logs continued to grow. We disabled trace flag 634. Then we enabled trace flag 661, and the logs continued to grow, so we disabled it. Finally, we tried enabling both of the trace flags. The big jumps stopped, but we now had about 400GB of logs that needed to be written to the reporting cluster before we could perform the failover.
While the logs were exploding we wondered if whatever was happening might have been caused by the deletions we did in early February. But why would they be triggered by the upgrade to SQL Server 2019?
We figured we could just let whatever was running, keep running, and maybe it’d eventually stop. However remember I mentioned one of the reasons we deleted a bunch of data from PRIZM was due to disk space being utilized? Well, the t-log growth was rapidly taking that back. The morning of the upgrade we were at 83% being used, as the day went on we were approaching 90%. This became an urgent issue because the growth was not slowing down and honestly we were worried we’d run out of disk space if we just let it play out.
It was time to open a support ticket. Hopefully support could help us.
A brief side note, before we enabled the trace flags we were getting lots of exceptions across the network. Once we enabled them, the exceptions slowed. Coincidence?
Time to Investigate
The next morning we still had logs that were being written to the reporting cluster, 195GB to be exact. Yes I know that as ridiculously high still, but we have throughput issues between our two datacenters (that’s a whole different story). Due to the size of the recovery queue that meant no failover until that flushed.
We heard back from support, so it was time to investigate. They requested that we take a full dump file, which is pretty difficult since we have 1.5TB of memory on the Stack Overflow SQL Server and the C: drive isn’t large enough to capture that, so we went with a smaller filtered dump and 3 minidumps. That meant another public outage, but we needed the files for them.
When we took the dump files, we disabled both trace flags (634 and 661), during the 10 minutes the trace flags were off, the transaction logs increased another 25-30GB.
We’re Being Haunted by Ghosts
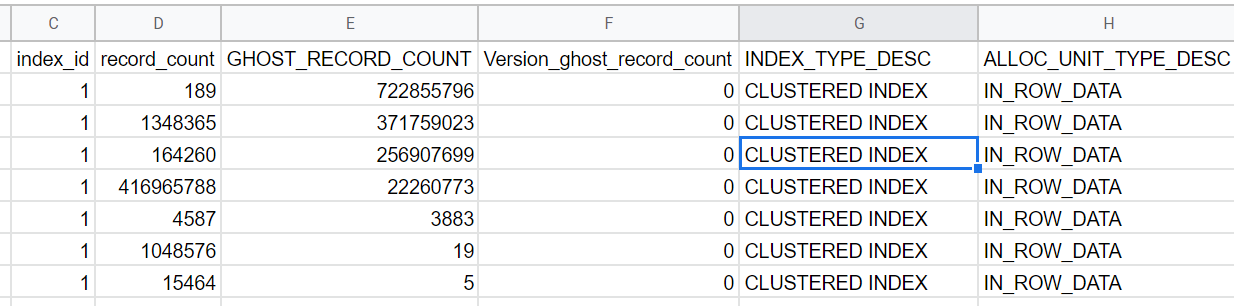
After providing the dump files, they requested that we check the status of the ghost records in the database using and provide the results:
|
|
The results of the query were:
After running the query, I performed another test for support, which involved:
- Taking a t-log backup
- Removing both trace flags 634 and 661 allowing the logs to increase
- Enabling the trace flags
- Taking another log backup
Disabling the trace flags for just a few minutes resulted in the logs increasing rapidly, but in looking at the results from the query above, the total number of ghost records dropped.
I decided to test further to see if disabling the trace flags would fully remove the GHOST_RECORD_COUNT. Each time both trace flags were disabled, the total ghost records would drop and the t-logs would explode in size, but we weren’t sure which trace flag we should keep enabled, so it was time for yet another test.
I tried just disabling trace flag 661, which would allow the ghost record process to run. I wanted to see if the cleanup process would finish, and the logs would stop growing. Eventually, the total number of ghost records dropped to zero, and the logs seemed to stop growing. Problem partially solved.
Oh, Tuple Mover what are you doing?
Now that one of the trace flags was disabled, we had to deal with trace flag 634 which we did not have enabled on SQL Server 2017. I started querying the status of the rowgroups on each table and I found something that appeared odd. I ran the following query for a specific table in PRIZM:
|
|
The results showed a lot of rowgroups in a TOMBSTONE state:
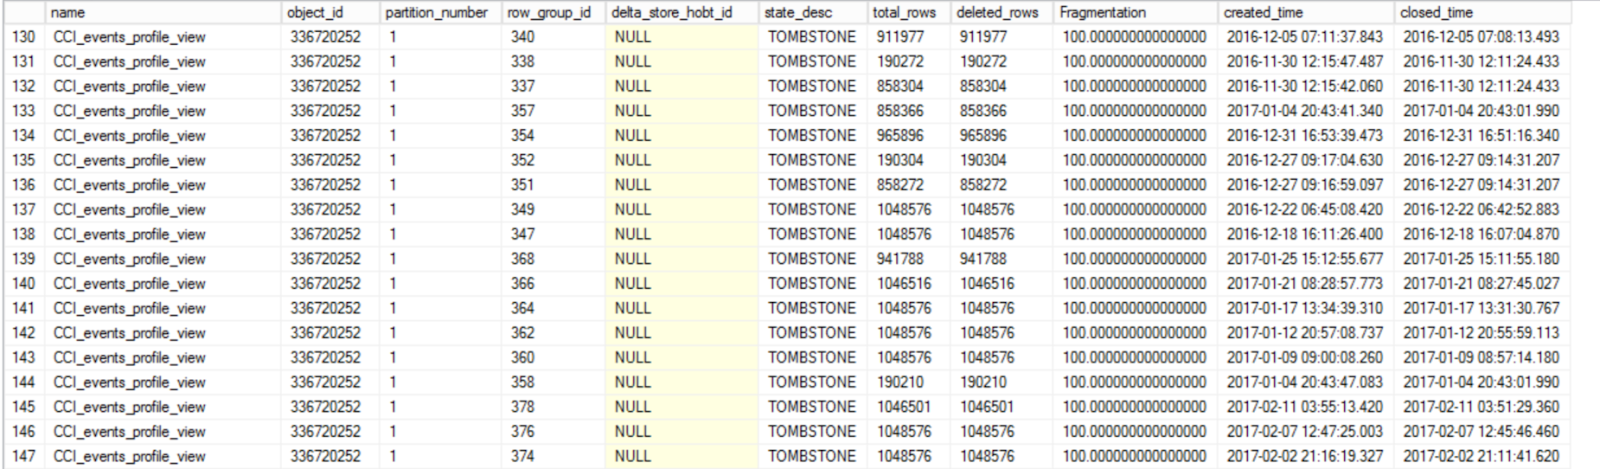
This was curious to me because, in my limited experience with clustered columnstore, these older closed rowgroups in a TOMBSTONE state should have been cleaned up a long time ago, well before we upgraded to SQL Server 2019.
On April 15th, I ran a test disabling trace flag 634. As soon as the trace flag was disabled, we experienced several things:
- transaction log growth
- a drop in the total number of
TOMBSTONErowgroups - and, a dramatic increase in query timeouts on the server
I left the trace flag disabled for several hours, all the while monitoring the 3 things above.
About mid-day, I re-enabled the trace flag on the server. When I did that, the logs stopped growing, the total number of TOMBSTONE rowgroups stopping decreasing, and the flood of query timeouts we saw throughout the entire test slowed to a trickle. All of this information was passed along to support. They suggested that the TUPLE_MOVER doesn’t touch the TOMBSTONE rowgroups and that should only be handled by the ghost cleanup process, but that was not the behavior we were seeing. They requested another test, but this time they also wanted us to keep track of the OPEN and CLOSED rowgroups.
The next day, it was time to try this again. Prior to disabling trace flag 634, we had the following rowgroup states in the PRIZM database:
| Total | State |
|---|---|
| 581 | TOMBSTONE |
| 672 | OPEN |
| 167 | CLOSED |
I left the trace flag off for about 2 hours. While it was disabled, the transaction logs grew 136GB, and we also experienced significant CXPACKET waits across the server which resulted in a lot of queries timing out.
The total number of TOMBSTONE row groups dropped during that time, eventually dropping to ~13 rowgroups. Once the TOMBSTONE totals bottomed out, the number of CLOSED rowgroups started to drop, and the total TOMBSTONE rowgroups started to increase again. When the test was complete, the rowgroup state totals were:
| Total | State |
|---|---|
| 48 | TOMBSTONE |
| 672 | OPEN |
| 131 | CLOSED |
I could only run the test for about 2 hours due to the amount of exceptions we saw. The curious thing is that when we enable the trace flag again, the number of queries that timeout on significantly decreases and the amount of CXPACKET waits we see also drops.
Next Steps
We’re still working with support on this, but we need to do one of a two choices:
-
Disable trace flag 634 and let it just finish whatever it’s doing while monitoring the rowgroup states. Maybe it would eventually stop aggressively increasing the transaction logs, we’re not sure. We have not done this yet because having this backlog allows us to test other fixes, but it also just fixes the immediate issue, it doesn’t prevent us from hitting this issue again later if we need to perform another large delete in PRIZM.
-
Manually rebuild the 11 tables that were never rebuilt. I tried to do this online several times now that we’re on SQL Server 2019, but it results in blocking of data being inserted to PRIZM, which is a shame since we were hoping to use that feature. In order for us to rebuild, we’ll need to disable any of the processes that use PRIZM first, then rebuild each table, so that will be done at a later date.
We have some other issues in progress with SQL Server 2019, so I’m juggling those issues and this one. I’m hoping for a resolution soon on this, but before I forgot any of the details I wanted to share them.
Final Thoughts
We still have a lot of outstanding questions on this, the biggest one being, why did the upgrade to SQL Server 2019 trigger what appears to be a massive cleanup of these clustered columnstore indexes? We didn’t have either trace flag enabled on SQL Server 2017, so there shouldn’t have been anything preventing the clean-up of the ghost records or the TOMBSTONE rowgroups, so why did this happen immediately after we failed over to 2019? Is there something different about it being an in-place upgrade?
If you have tested SQL Server 2019 and you use clustered columnstore indexes, have you seen this behavior? If so, what did you do to fix the issue? Did you just enable the trace flags and leave them on?
And yes we were eventually able to failover the reporting cluster…I know you were worried. :)
A follow-up on the next steps has been posted here.